
RESEARCH
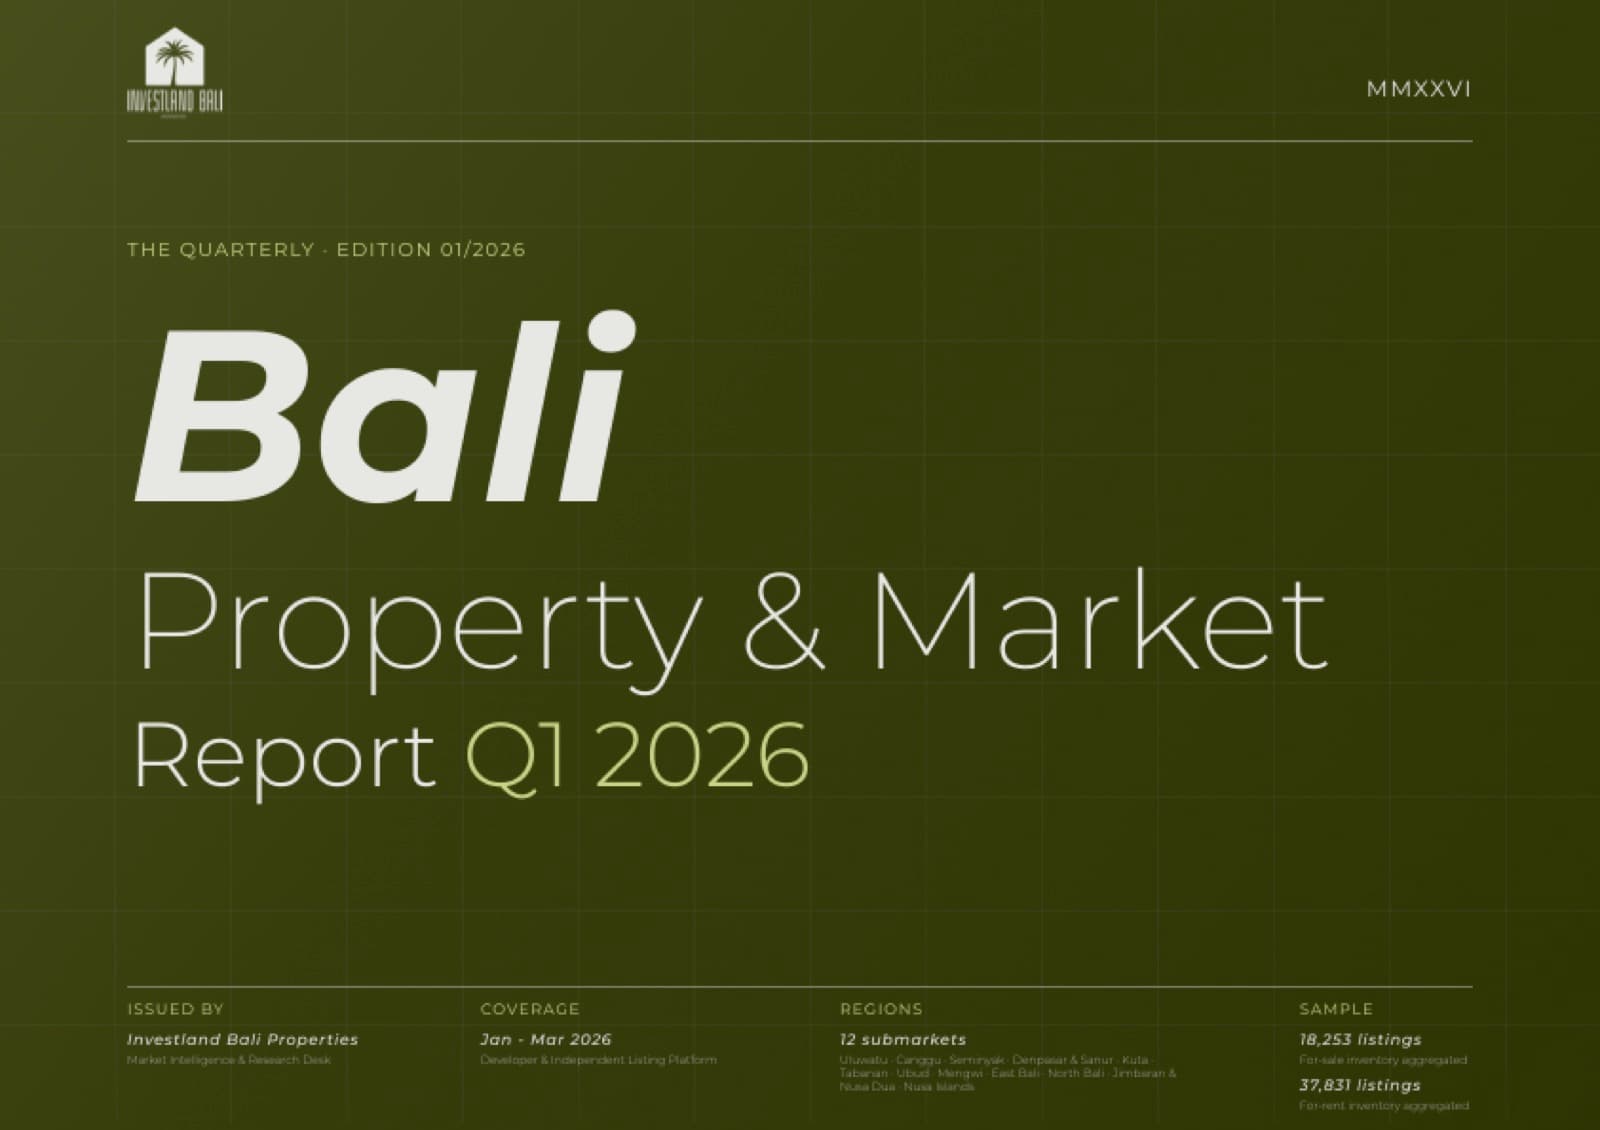
Bali Property & Market Report | Q1 2026
MAY 5, 2026
Measured supply growth meets resilient tourism fundamentals — 18,253 active for-sale listings and 1.47 million arrivals in the first quarter.
Top Highlights
- Uluwatu and Canggu remain the highest-conviction positions — the deepest inventory, the strongest ADR performance ($181 and $168 per night), and PPSQM valuations above $1,650/sqm.
- The 26–30 year leasehold bracket is the market's structural sweet spot: the highest liquidity of any tenure band (2,817 listings) alongside $1,970/sqm valuations.
- Mengwi and Tabanan sit 14% below the market PPSQM/year benchmark at $63/sqm/yr while still recording supply growth — the clearest catch-up candidates.
At a glance
- International arrivals
- 1,466,564
- Median asking price
- $243K
- Active for-sale listings
- 18,253
- Top ADR — Uluwatu
- $181
- Leasehold share of supply
- 70.4%
+1.02% YoY · −11.2% QoQ
Built properties
+1.2% MoM (Feb–Mar)
per night
of active inventory
| Submarket | Active listings |
|---|---|
| Canggu | 4,162 |
| Uluwatu | 3,574 |
| Seminyak | 2,328 |
| Jimbaran & Nusa Dua | 2,112 |
| Ubud | 1,839 |
| Denpasar & Sanur | 1,425 |
| Mengwi Area | 1,093 |
| Tabanan | 1,053 |
| Kuta | 340 |
| East Bali | 146 |
| North Bali | 110 |
| Nusa Islands | 71 |
| All submarkets | 18,253 |
Source: Investland Bali Properties, February–March 2026 listing snapshots. Pricing is reported for the eight submarkets with 400 or more active listings and is not shown here.
Bali's property market in Q1 2026 shows measured supply growth alongside resilient tourism fundamentals. Over 1.46 million international visitors arrived in the first quarter, sustaining +1.02% year-on-year growth. The for-sale market recorded 18,253 active listings across monitored platforms, with month-on-month supply expanding 1.2% from February to March. Median asking prices for built properties held at $243K, while the short-term rental market demonstrated strong pricing power in southern coastal corridors, led by Uluwatu at $181 per night. Leasehold properties account for 70.4% of active supply, underscoring the continued dominance of investment-oriented inventory across the island's twelve core submarkets.
What's inside
Nineteen chapters tracing demand, supply, price, and leasehold ownership across Bali's twelve core property submarkets.
- Demand — arrivals, source markets and hotel occupancy.
- Supply — contract-type distribution, regional concentration and listing depth, property composition.
- Pricing — median asking prices by region, price per square metre, and a region × bedroom pricing matrix.
- Leasehold — tenure buckets and price per square metre per remaining year.
- Rental — ADR by region and property type, plus the tourism × property overlay.
- Outlook — three positions for the cycle, with preferred region, tenure and format.
Coverage and method
Property market data is based on February and March 2026 listing snapshots aggregated from developer and independent listing platforms. Tourism data covers the full January–March quarter, sourced from BPS Provinsi Bali. The sample spans 18,253 for-sale and 37,831 for-rent listings across twelve submarkets: Uluwatu, Canggu, Seminyak, Denpasar & Sanur, Kuta, Tabanan, Ubud, Mengwi, East Bali, North Bali, Jimbaran & Nusa Dua, and the Nusa Islands.
- Coverage
- Jan – Mar 2026
- Regions
- 12 submarkets
- Sample
- 18,253 for-sale · 37,831 for-rent listings
- Pages
- 19
Issued by: Investland Bali Properties · Market Intelligence & Research Desk