
RESEARCH
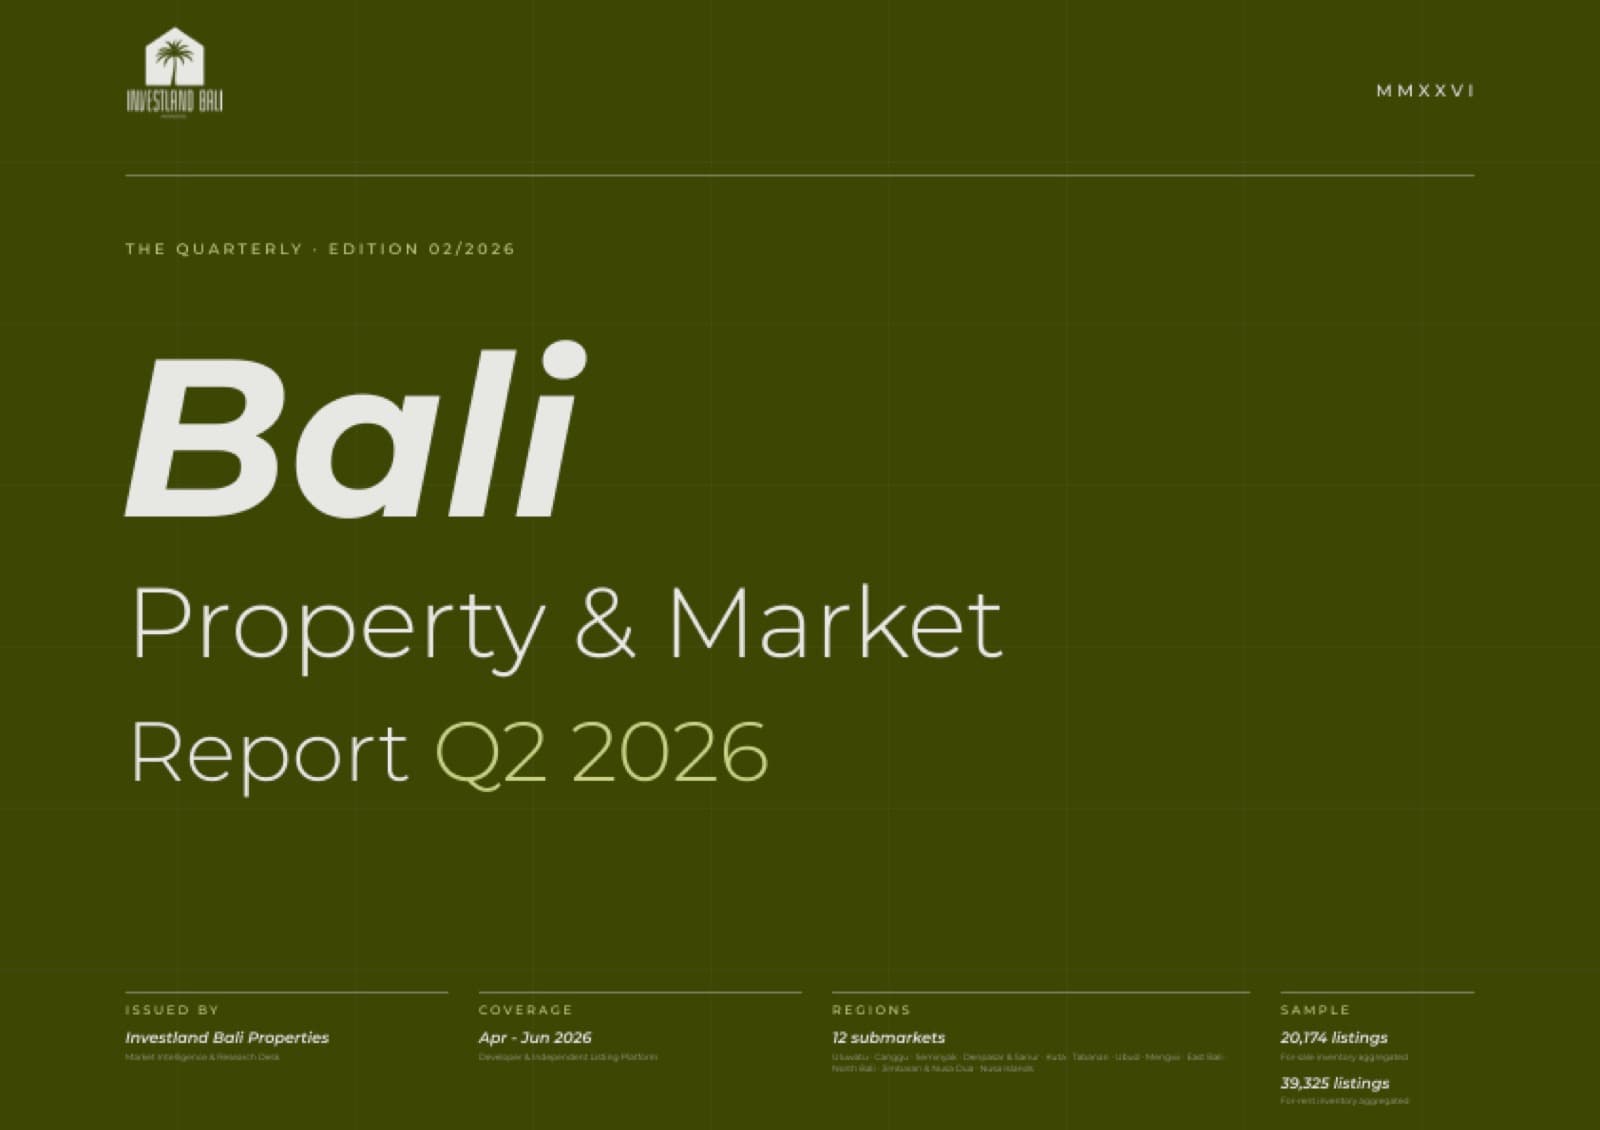
Bali Property & Market Report | Q2 2026
AUG 5, 2026
Demand rebounds while supply holds flat — 1.74 million arrivals in the second quarter against 20,174 active for-sale listings, 1.4% below Q1 on constant sources.
Top Highlights
- Canggu and Uluwatu remain the highest-conviction positions — the deepest inventory on the island (4,505 and 3,845 active listings), per-metre pricing of $1,747 and $1,509 against a $1,339 benchmark, and Uluwatu's island-high $181 nightly rate at a 15.1% leasehold yield.
- The 21–30 year leasehold band holds 3,962 of the 5,255 listings with a recorded term — 75% of the market. Within it, 26–30 years asks $1,875/sqm against $1,763 for 21–25, which buys roughly five more years of tenure.
- Mengwi Area and Tabanan price at $57 and $65 per sqm per year of remaining lease, 20% and 8% below the $71 market median — the cheapest tenure-adjusted entry on the island, though June supply fell 3.9% and 10.3% and neither shows momentum yet.
At a glance
- International arrivals
- 1,736,592
- Median asking price
- $233K
- Active for-sale listings
- 20,174
- Top ADR — Uluwatu
- $181
- Leasehold share of supply
- 73.2%
−5.2% YoY · +18.4% QoQ
Built properties
−1.4% QoQ on constant sources
per night
of comparable supply
| Submarket | Active listings |
|---|---|
| Canggu | 4,505 |
| Uluwatu | 3,845 |
| Seminyak | 2,412 |
| Ubud | 2,201 |
| Jimbaran & Nusa Dua | 2,163 |
| Denpasar & Sanur | 1,984 |
| Tabanan | 1,239 |
| Mengwi Area | 1,206 |
| Kuta | 277 |
| East Bali | 160 |
| North Bali | 131 |
| Nusa Islands | 51 |
| All submarkets | 20,174 |
Source: Investland Bali Properties, April–June 2026 listing snapshots across nine independent platforms. Pricing is reported for the eight submarkets with 400 or more active listings and is not shown here.
Bali's property market in Q2 2026 shows demand recovering sharply while supply held flat. International arrivals reached 1.74 million in the second quarter, a +18.4% rebound from Q1 though still 5.2% below the same quarter of 2025. On a constant-source basis the for-sale market contracted 1.4% against Q1; the +13.4% figure across all platforms reflects one source tripling its crawl coverage in April rather than new inventory reaching the market. Median asking prices for built properties held at $233K while price per square metre eased 4%, even as rental rates rose — the mean nightly rate reached $152, up 3% on Q1. Leasehold accounts for 73.2% of comparable supply, and indicative gross yields widened as rents climbed against flat prices, with leasehold villas yielding a median 3.4 percentage points above freehold in the same submarket.
What's inside
Nineteen chapters tracing demand, supply, price, and leasehold ownership across Bali's twelve core property submarkets.
- Demand — arrivals, source markets and hotel occupancy.
- Supply — contract-type distribution, regional concentration and listing depth, property composition.
- Pricing — median asking prices by region, price per square metre, and a region × bedroom pricing matrix.
- Leasehold — tenure buckets and price per square metre per remaining year.
- Rental — ADR by region and property type, plus mean rates by bedroom count.
- Outlook — four themes for the cycle and three positions, with preferred region, tenure and format.
Coverage and method
Property market data is based on April, May and June 2026 listing snapshots aggregated from nine independent listing platforms. Tourism data covers the full April–June quarter, sourced from BPS Provinsi Bali. The sample spans 20,174 for-sale and 39,325 for-rent listings across twelve submarkets: Uluwatu, Canggu, Seminyak, Denpasar & Sanur, Kuta, Tabanan, Ubud, Mengwi, East Bali, North Bali, Jimbaran & Nusa Dua, and the Nusa Islands.
Two method notes carry through the whole edition. One platform tripled its crawl coverage in April, so every quarter-on-quarter supply comparison is given on constant sources — the platforms present in both quarters — rather than on the headline total. And every USD figure is recomputed at 17,529 IDR, the rate Colliers used for the quarter, which restates the Q1 series roughly 3.7% lower than the Q1 report as published while leaving the quarter-on-quarter directions unchanged.
- Coverage
- Apr – Jun 2026
- Regions
- 12 submarkets
- Sample
- 20,174 for-sale · 39,325 for-rent listings
- Pages
- 19
Issued by: Investland Bali Properties · Market Intelligence & Research Desk