
Bali Airbnb Income 2026: Real Earnings Data by Area, Property Type and Season
Bali Airbnb properties generate $20,000 to $80,000 in gross annual revenue in 2026, depending on location, property size, and management quality. After operating costs, platform commissions, and the 10% rental income tax, net income typically falls between $8,000 and $35,000 per year. The gap between those two numbers is where most investor miscalculations happen, and it comes down to three variables: where the property sits, how it is operated, and whether the owner understands the seasonal income cycle that defines Bali's rental market.
Every investor considering a Bali villa asks the same question: how much will I actually earn?
The answer is not a single number. It is a range shaped by property type, location, seasonality, management model, and legal structure. A two-bedroom villa in Canggu and a two-bedroom villa in Ubud sit at different points on that range, even at the same purchase price.
This article breaks down exactly what Bali Airbnb properties earn in 2026, month by month and area by area. All figures are based on AirDNA market data, BPS Bali hotel occupancy statistics, and current operating data from professionally managed portfolios across Bali's six primary investment zones.
For the percentage return on investment, see our companion article on Bali rental yield. This article focuses on the Bali Airbnb income side: what comes in, what goes out, and what you keep.
What Bali Airbnb Properties Actually Earn

Understanding Bali Airbnb income starts with separating platform-wide averages from what professionally managed investment properties generate. The island-wide average Bali Airbnb listing generates approximately $21,000 per year at 65% occupancy with a $98 average daily rate. That figure includes everything from studio apartments to luxury estates, which makes it misleading for villa investors.
Professionally managed villas in Bali's primary tourism zones earn considerably more. The range depends almost entirely on property size and location quality.
Gross Annual Income by Property Size
| Property type | Avg daily rate (ADR) | Annual occupancy | Gross annual income | Monthly average |
|---|---|---|---|---|
| 1-bedroom villa or apartment | $120 to $180 | 68 to 78% | $30,000 to $51,000 | $2,500 to $4,250 |
| 2-bedroom villa | $180 to $260 | 65 to 75% | $43,000 to $71,000 | $3,580 to $5,920 |
| 3-bedroom villa | $250 to $380 | 60 to 72% | $55,000 to $100,000 | $4,580 to $8,330 |
| 4+ bedroom villa | $350 to $550 | 55 to 68% | $70,000 to $136,000 | $5,830 to $11,330 |
These ranges reflect professionally managed properties in A-zone and B-zone locations (Canggu, Uluwatu, Pererenan, Seminyak, Ubud, Sanur). Self-managed properties or those in secondary locations typically earn 20 to 30% less.
Two patterns stand out in this data. First, ADR scales with bedrooms, but occupancy moves in the opposite direction. Larger villas command higher nightly rates but book fewer nights per year because the guest pool narrows as price increases. A one-bedroom at $150 per night fills more easily than a four-bedroom at $450.
Second, the monthly average masks extreme seasonal variation. A two-bedroom villa earning $60,000 annually does not earn $5,000 every month. Peak months generate $7,000 to $9,000. Low-season months drop to $2,500 to $3,500. That cash flow pattern shapes everything from maintenance budgets to mortgage coverage.
Bali Airbnb Income by Area: Where the Money Is

Location determines Bali Airbnb income through the relationship between achievable nightly rates and sustainable occupancy. Premium areas command higher ADR but do not always deliver proportionally higher income because occupancy, competition density, and seasonality all vary by location.
Bali Airbnb Income by Location (2-Bedroom Villa)
| Area | Avg ADR | Annual occupancy | Gross annual income | Net annual income | Profile |
|---|---|---|---|---|---|
| Canggu/Berawa | $220 | 72% | $57,800 | $23,000 to $29,000 | Highest demand in Bali. Digital nomad hub with year-round bookings. 8,000+ competing listings keep ADR pressure constant. Best for consistent occupancy. |
| Uluwatu/Bingin | $260 | 62% | $58,800 | $23,500 to $29,500 | Luxury positioning with highest ADR in Bali. Strong Instagram-driven demand. Lower occupancy due to limited walk-to dining and transport dependency. Best for premium pricing. |
| Pererenan/Seseh | $200 | 70% | $51,100 | $20,400 to $26,000 | Emerging area between Canggu and Tanah Lot. Lower entry prices deliver stronger yield percentages. Growing rapidly with new developments. Best for value-oriented investors. |
| Seminyak | $230 | 65% | $54,600 | $21,800 to $27,500 | Established premium area with strong restaurant and beach club scene. 1,700+ listings create intense competition. Higher purchase prices compress yield. Best for brand-name recognition. |
| Ubud | $155 | 65% | $36,800 | $14,700 to $18,800 | Wellness and cultural tourism. Longer average stays (4 to 7 nights), lower ADR, lower operating costs. Strong for yoga retreats and long-stay digital nomads. Best for lifestyle investors. |
| Sanur | $165 | 63% | $37,900 | $15,200 to $19,100 | Family-friendly with medical tourism proximity. Stable long-term rental demand, less seasonal volatility than the west coast. Best for conservative investors. |
Net annual income assumes 50 to 60% of gross consumed by operating costs and taxes, which is the realistic range for professionally managed standalone villas in Bali.
The numbers show two distinct tiers. Canggu, Uluwatu, Pererenan, and Seminyak cluster between $51,000 and $59,000 gross for a two-bedroom villa. Ubud and Sanur sit lower at $37,000 to $38,000 gross. The gap is driven by ADR rather than occupancy. International guests in the south and west coast areas pay more per night than the cultural and wellness tourism segments in Ubud and Sanur.
That said, Ubud and Sanur have meaningfully lower purchase prices and operating costs. A $200,000 villa in Ubud earning $18,000 net delivers a stronger yield percentage than a $350,000 villa in Seminyak earning $27,000 net. Income and yield tell different stories, which is why both articles exist.
The Seasonal Income Cycle

Bali's rental income follows a predictable seasonal pattern driven by international school holidays, weather, and cultural events. Understanding this cycle is essential for cash flow planning.
Monthly Income Pattern (2-Bedroom Villa, Canggu, $220 ADR Base)
| Month | Occupancy | Effective ADR | Gross income | Category |
|---|---|---|---|---|
| January | 75% | $240 | $5,580 | Peak (New Year carryover) |
| February | 48% | $175 | $2,450 | Low season |
| March | 50% | $180 | $2,790 | Low season |
| April | 58% | $195 | $3,390 | Shoulder (Easter variable) |
| May | 60% | $200 | $3,720 | Shoulder |
| June | 72% | $230 | $4,970 | High season onset |
| July | 88% | $290 | $7,900 | Peak |
| August | 90% | $300 | $8,370 | Peak |
| September | 68% | $215 | $4,390 | Shoulder |
| October | 55% | $190 | $3,140 | Low season |
| November | 52% | $185 | $2,880 | Low season |
| December | 82% | $270 | $6,860 | Peak (Christmas/New Year) |
| Annual total | 66% | $222 avg | $56,440 |
Peak months (July, August, December, January) generate 51% of annual revenue in just four months. Low-season months (February, March, October, November) produce only 20% of the annual total. This means any investor budgeting based on peak-month performance will face a cash flow gap of $3,000 to $5,000 per month during the low season.
Three strategies mitigate seasonal income drops:
Monthly rental pivots. Switching to 30-day minimum stays at $2,200 to $2,800 per month during February through May captures digital nomad demand. Monthly rates deliver lower per-night income but eliminate vacancy gaps and reduce turnover costs.
Dynamic pricing. Properties using algorithmic daily pricing capture 15 to 25% more annual revenue than those with static rates, according to AirDNA market analysis. Dynamic pricing increases rates during demand spikes (weekends, local events, last-minute searches with low availability) and drops rates to fill gaps during slow periods.
Event-based premiums. Bali has several annual demand spikes beyond school holidays: Nyepi (Balinese New Year), Ubud Writers Festival, Bali Spirit Festival, and major surf competitions at Uluwatu. Properties that calendar-block and reprice for these events capture $50 to $150 premium per night above base rates.
What Comes Out: The Real Cost of Operating a Bali Airbnb

Gross income is not what you keep. Operating costs consume 50 to 60% of gross revenue for standalone villas on short-term rental. Hotel-operated apartments run lower at 30 to 35% due to shared infrastructure.
Here is a complete cost breakdown for a two-bedroom villa earning $57,000 gross annually in Canggu.
Annual Operating Cost Breakdown
| Cost category | Annual amount | % of gross |
|---|---|---|
| Property management fee (15 to 20% of gross) | $8,550 to $11,400 | 15 to 20% |
| OTA platform commissions (Airbnb 14 to 16%, Booking.com 15 to 18%) | $6,270 to $8,550 | 11 to 15% |
| Staff (housekeeper, pool maintenance, gardener) | $5,400 to $7,200 | 9 to 13% |
| Utilities (electricity, water, internet, gas) | $3,000 to $4,200 | 5 to 7% |
| Maintenance and repairs | $2,500 to $4,000 | 4 to 7% |
| Guest supplies and amenities | $1,200 to $1,800 | 2 to 3% |
| Insurance and property tax (PBB) | $500 to $800 | 1 to 2% |
| Rental income tax (10% of gross under PP 34/2017) | $5,700 | 10% |
| Total operating costs | $33,120 to $43,650 | 58 to 77% |
| Net income | $13,350 to $23,880 | 23 to 42% |
The range is wide because management fee percentage, platform commission mix, and staffing decisions vary by operator and owner. The midpoint, 60% of gross consumed by costs, is the figure most professionally managed properties converge on. That leaves 40% as net income before any capital reserves for major repairs.
Three cost categories deserve closer attention.
Management fees are the largest controllable cost. Full-service management at 18 to 20% of gross covers guest communication, listing optimization, dynamic pricing, cleaning coordination, maintenance scheduling, and financial reporting. Cutting to a 10 to 12% discount operator saves $3,000 to $4,000 annually but typically reduces occupancy by 10 to 15 percentage points through weaker marketing, slower response times, and inconsistent guest experience. That occupancy drop costs $5,000 to $8,000 in lost revenue. The math favours professional management.
Platform commissions are unavoidable until you build direct bookings. Airbnb charges 14 to 16% on the host-only fee model. Booking.com charges 15 to 18%. Properties generating 30 to 40% of bookings through their own website or repeat guests reduce blended commission from 15% to 8 to 10%. Building direct booking volume requires a branded website, Google presence, and 2 to 3 years of reputation building.
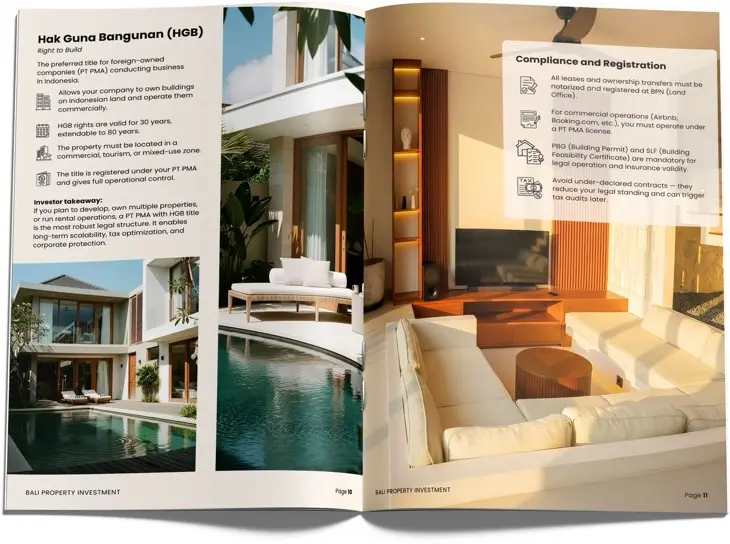
The 10% rental income tax applies to gross revenue, not net profit. Under PP 34/2017, Indonesia levies a 10% final tax on gross rental income for entities with proper legal structures (PT PMA). Foreign individuals without a PT PMA face 20% withholding tax on gross, though this may be reduced under double-taxation treaties. On $57,000 gross revenue, the difference between 10% and 20% is $5,700 per year. The PT PMA setup cost of $3,000 to $5,000 pays for itself within the first year.
Licensing and Compliance: The 2026 Regulatory Reality

Operating a short-term rental in Bali without proper licensing has always been technically illegal. As of 2026, enforcement has teeth.
Airbnb, Booking.com, and Expedia began requiring valid NIB (Nomor Induk Berusaha) documentation from Bali hosts in early 2026. Properties that cannot provide proof of licensing face delisting from major booking platforms, according to RUMAVI's regulatory guide.
What You Need to Operate Legally
| Requirement | What it is | Approximate cost |
|---|---|---|
| NIB (Nomor Induk Berusaha) | Business identification number via OSS | IDR 5 to 10 million ($310 to $625) |
| Pondok Wisata or TDUP | Tourism accommodation license (Pondok Wisata for up to 5 rooms, TDUP for larger operations) | IDR 10 to 25 million ($625 to $1,560) |
| PBG (Persetujuan Bangunan Gedung) | Building approval certificate | IDR 15 to 40 million ($940 to $2,500) |
| SLF (Sertifikat Laik Fungsi) | Building safety and function certificate | IDR 10 to 30 million ($625 to $1,875) |
| Tax registrations (NPWP + PHR) | Income tax ID and hotel tax registration | IDR 5 to 15 million ($310 to $940) |
| Total initial compliance | IDR 45 to 120 million ($2,810 to $7,500) | |
| Annual renewal and compliance | Accounting, tax filing, license renewals | IDR 14 to 26 million ($875 to $1,625/year) |
Two critical points for foreign investors:
Foreign individuals cannot hold a Pondok Wisata license directly. You must operate through a PT PMA company or, in leasehold situations, have your Indonesian landlord hold the license. The PT PMA route adds $5,000 to $8,000 in formation costs but provides the legal structure for both licensing and tax-efficient rental operations.
Zoning matters more than ever. Approximately 80% of villas in areas like Canggu sit in zones where short-term rental is not permitted under current zoning regulations. Properties in non-tourism zones (green or yellow on the RDTR zoning map) cannot obtain a Pondok Wisata license regardless of how much you spend on applications. Verify zoning before purchasing, not after. Our due diligence guide covers the zoning verification process step by step, and the Bali land zones explainer maps out what each zone designation means for rental operations.
The total compliance cost adds $3,500 to $9,000 to year-one expenses. That cost should be factored into your income projections. On a $57,000 gross revenue property, licensing and compliance represent 6 to 16% of first-year gross income, dropping to 1.5 to 3% in subsequent years as only annual renewals apply.
How to Maximise Your Bali Airbnb Income

The difference between the bottom and top of the income range for any given property type comes down to three operational decisions.
1. Professional Revenue Management
Properties using daily dynamic pricing consistently outperform static-rate listings by 15 to 25% in annual revenue. Dynamic pricing adjusts rates based on day of week, competitor pricing, booking lead time, local events, and real-time demand signals.
The practical impact: a two-bedroom Canggu villa on static pricing at $200 per night earns approximately $48,000 gross annually at 66% occupancy. The same villa on dynamic pricing earns $57,000 to $60,000 by charging $290 to $300 in July and August, $170 to $180 in February and March, and capturing weekend premiums of 15 to 25% above weekday rates.
Professional management companies with revenue management capabilities, including Pellago for Investland properties, handle dynamic pricing as part of their operational package.
2. Brand Building and Direct Bookings
Every booking through Airbnb or Booking.com costs 14 to 18% in platform commissions. A villa generating $57,000 gross through OTAs alone pays $8,000 to $10,000 in commissions. Shifting 30 to 40% of bookings to a direct channel (branded website, repeat guests, referrals) reduces blended commission to 8 to 10%, saving $3,000 to $5,000 annually.
Direct booking volume requires investment: a branded website ($2,000 to $5,000 to build), a Google Business profile, social media presence, and 2 to 3 years of reputation building. The payoff is cumulative. Year one may generate 5 to 10% direct bookings. By year three, well-positioned villas with strong review profiles achieve 30 to 40%.
Villas with a name, a visual identity, and a story command $40 to $70 more per night than generic listings with stock photography and no differentiation. That brand premium alone adds $8,000 to $15,000 in annual gross revenue.
3. Guest Experience as a Revenue Driver
Airbnb's algorithm rewards properties with high review scores, fast review accumulation, and strong response rates. Properties above 4.9 stars with 50+ reviews earn 20 to 30% more per night than comparable properties rated 4.7 with fewer reviews.
What drives review scores in Bali specifically:
- Fast check-in. Airport transfer arranged, WhatsApp welcome message sent before arrival, villa guide with WiFi and restaurant recommendations printed and waiting.
- Pool and outdoor space quality. Guests book Bali villas for outdoor living. A well-maintained pool and garden generate more positive reviews than interior finishes.
- Responsiveness. Guests expect replies within one hour across all channels. Properties with 95%+ response rates within one hour rank measurably higher in Airbnb search results.
- Local experience. Guests who book a villa over a hotel want to feel like they are living in Bali, not visiting it. Cooking classes, scooter rental coordination, temple ceremony invitations, and neighbourhood walking guides turn good stays into five-star reviews.
Short-Term Rental vs Long-Term Rental: Income Comparison

Not every Bali investment property belongs on Airbnb. Long-term monthly rentals trade lower gross income for lower costs and higher predictability.
Annual Income Comparison (2-Bedroom Villa, Canggu, $250,000 Purchase Price)
| Factor | Short-term rental (Airbnb) | Long-term rental (monthly) |
|---|---|---|
| Monthly rate | $220/night (variable) | $2,500 to $3,000/month (fixed) |
| Annual occupancy | 66% (241 nights) | 91% (11 months) |
| Gross annual income | $53,000 | $27,500 to $33,000 |
| Operating cost ratio | 50 to 60% of gross | 20 to 30% of gross |
| Total operating costs | $26,500 to $31,800 | $5,500 to $9,900 |
| Rental income tax (10% of gross) | $5,300 | $2,750 to $3,300 |
| Net annual income | $15,900 to $21,200 | $16,500 to $23,100 |
| Management intensity | High (daily operations) | Low (monthly tenants) |
| Personal use flexibility | Flexible (block dates) | None |
| Cash flow predictability | Variable (seasonal) | Stable (monthly fixed) |
The Bali Airbnb income comparison reveals something counterintuitive: long-term rental can deliver comparable or higher net income than short-term rental on the same property. The reason is cost structure. STR operating costs consume 50 to 60% of gross through management fees, platform commissions, frequent cleaning, and guest amenities. LTR operating costs run 20 to 30% because there are no platform commissions, less turnover, simpler management, and fewer supplies.
Short-term rental wins when a property achieves above-average occupancy (70%+) with professional management and strong brand positioning. Long-term rental wins when an investor prioritises predictable monthly cash flow, minimal management involvement, and lower operational risk.
A hybrid model, short-term rental during peak season (June to September, December to January) and monthly rental during low season (February to May), can capture the best of both. The operational complexity is higher, but annual net income can exceed either pure strategy by 10 to 15%.
Frequently Asked Questions
How much does a Bali Airbnb villa earn per month?
Monthly Bali Airbnb income varies dramatically by season. A professionally managed two-bedroom villa in Canggu earns $7,000 to $9,000 per month during peak season (July, August, December) and $2,500 to $3,500 during low season (February, March). The annual average works out to $4,000 to $5,000 per month gross, with net income after all costs at $1,500 to $2,200 per month.
Is Airbnb still profitable in Bali in 2026?
Yes, but profitability depends on management quality, location, and legal compliance. Professionally managed properties in tourism-zoned locations with proper licensing earn 8 to 12% net rental yield on invested capital. Self-managed properties without dynamic pricing, professional photography, or proper legal structure underperform significantly. The 2026 licensing enforcement has removed non-compliant listings, reducing competition for licensed operators.
What is the average Airbnb occupancy rate in Bali?
The island-wide average occupancy rate is 65 to 66% annually, according to BPS Bali hotel occupancy data. Professionally managed properties in prime locations achieve 70 to 80%. Peak season (July to August) drives 85 to 95% occupancy. Low season (February to March) drops to 45 to 55%. The top 10% of properties maintain 80 to 95% year-round through professional management and dynamic pricing.
What tax do I pay on Bali Airbnb income?
Indonesia levies a 10% final tax on gross rental income under PP 34/2017 for entities with proper structures (PT PMA). Non-resident foreigners without a PT PMA face 20% withholding tax on gross income. The tax is on gross revenue, not net profit, which means $57,000 in gross income results in $5,700 tax regardless of how much you spend on operations. Setting up a PT PMA reduces the rate from 20% to 10% and typically pays for itself in the first year.
Do I need a license to run an Airbnb in Bali?
Yes. All short-term rental properties require a NIB (business identification number), a Pondok Wisata or TDUP accommodation license, a PBG building permit, an SLF safety certificate, and tax registrations. Foreign owners cannot hold these licenses individually and must operate through a PT PMA. The property must also be in a tourism-designated zone (pink on the RDTR zoning map). Total compliance costs range from IDR 45 to 120 million ($2,810 to $7,500) initially with annual renewal costs of $875 to $1,625.
Which area in Bali earns the most Airbnb income?
Uluwatu and Canggu generate the highest gross annual income for two-bedroom villas, both in the $57,000 to $59,000 range. Uluwatu achieves this through higher ADR ($260 per night average) with lower occupancy (62%). Canggu achieves it through moderate ADR ($220) with higher occupancy (72%). For net income, the areas perform similarly at $23,000 to $29,000 after costs. Ubud and Sanur earn less gross ($37,000 to $38,000) but offer lower purchase prices and operating costs.
How do hotel-operated apartments compare to standalone villas for Airbnb income?
Hotel-operated apartments earn lower gross revenue per unit ($30,000 to $50,000 for a one-bedroom) but retain a higher percentage as net income because operating costs are shared across 20 to 50 units. Net yield on hotel apartments runs 10 to 12% versus 8 to 12% for standalone villas. The trade-off is lower total income per unit, limited personal use, and less control over pricing and guest experience. See our rental yield comparison for detailed hotel apartment versus villa yield analysis.
The Bali Airbnb Income Equation
Bali Airbnb income is real, measurable, and achievable. The properties earning at the top of the range share three characteristics: they sit in tourism-zoned locations with proper licensing, they are professionally managed with dynamic pricing and strong guest experience, and they are structured correctly through a PT PMA for tax efficiency.
For a two-bedroom villa in one of Bali's primary investment zones, realistic expectations are $50,000 to $60,000 in gross annual revenue and $20,000 to $30,000 in net income after all operating costs and taxes. That translates to $1,700 to $2,500 per month in your pocket.
The investors who reach the top of that range treat their property as a business. They invest in professional management, build a brand, and optimise for long-term revenue growth. The investors who land at the bottom treat it as passive income and are surprised when it is not.
For investors ready to model specific scenarios based on actual market data, Investland Bali Properties provides full-service investment advisory, legal structuring through PT PMA, construction through Constructland, and property management through Pellago, all designed to maximise net income from day one.
Book a free investment consultation: investlandbali.com/contact.
Income projections are based on current market data and are not guaranteed. Actual returns depend on market conditions, property type, operator performance, management quality, and regulatory compliance.
About the author
Kristjan Ploompuu is the CEO of Investland Bali Properties. He has guided over 100 international investors from 18+ countries through Bali real estate transactions, overseeing more than EUR 120 million in lifetime transaction value. He leads Investland Bali's investment strategy, legal structuring, and partner selection.
Published: June 2026 | Last updated: June 2026